ABSTRACT
Many people may not be aware that the simple Bragg equation nλ=2Dsin(θ), which describes the phenomenon of x-ray reflection ("diffraction") by regular atomic planes,
also applies to all rays of any frequency made of any material objects reflecting off of regularly spaced planes; including photons, electrons, ions, even larger objects like sand grains or tennis balls. In particular, the Bragg equation applies to all periodic forms of light particles being dispersed by gratings (for example into the visible spectrum). This equation shows a very simple geometrical truth: that the more distant a light source, the more shifted away from the center, toward the red end, will be the position of the spectrum. So the position of the spectrum on the grating changes relative to the distance of the light source, but the frequency (color) of the spectrum does not change. In addition, if a slit is not used, the apparent horizontal size of the light source, effects the size of the spectrum too.
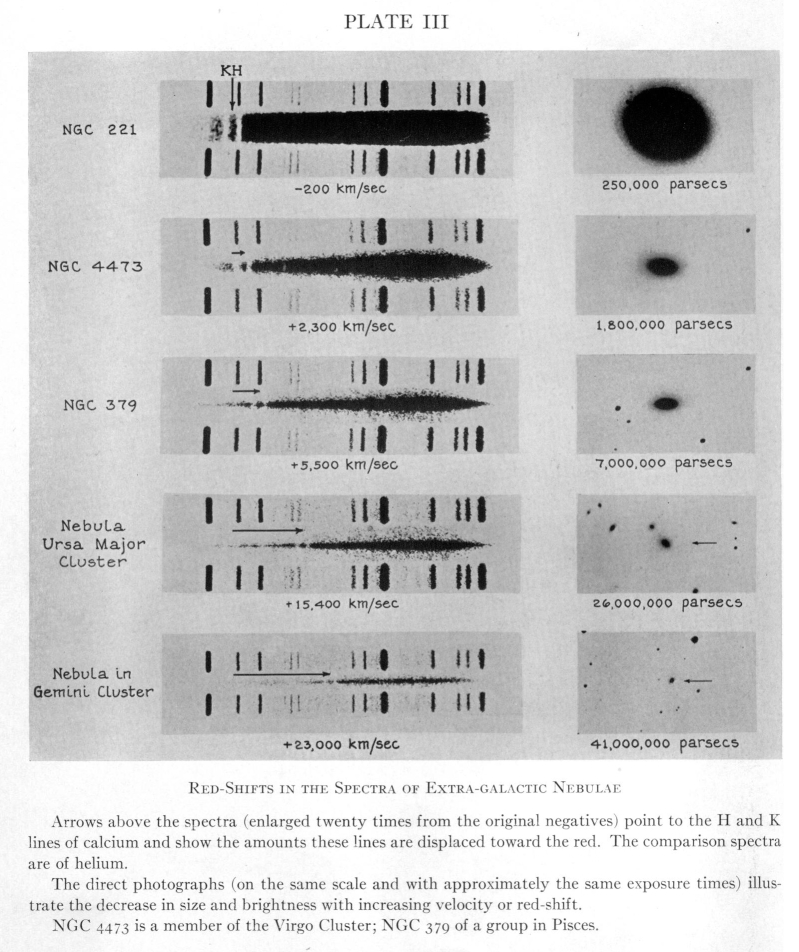
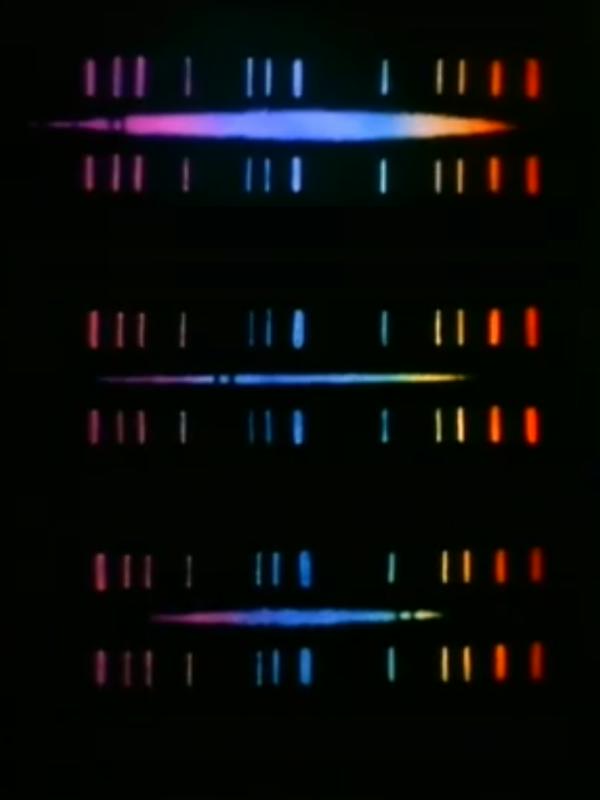
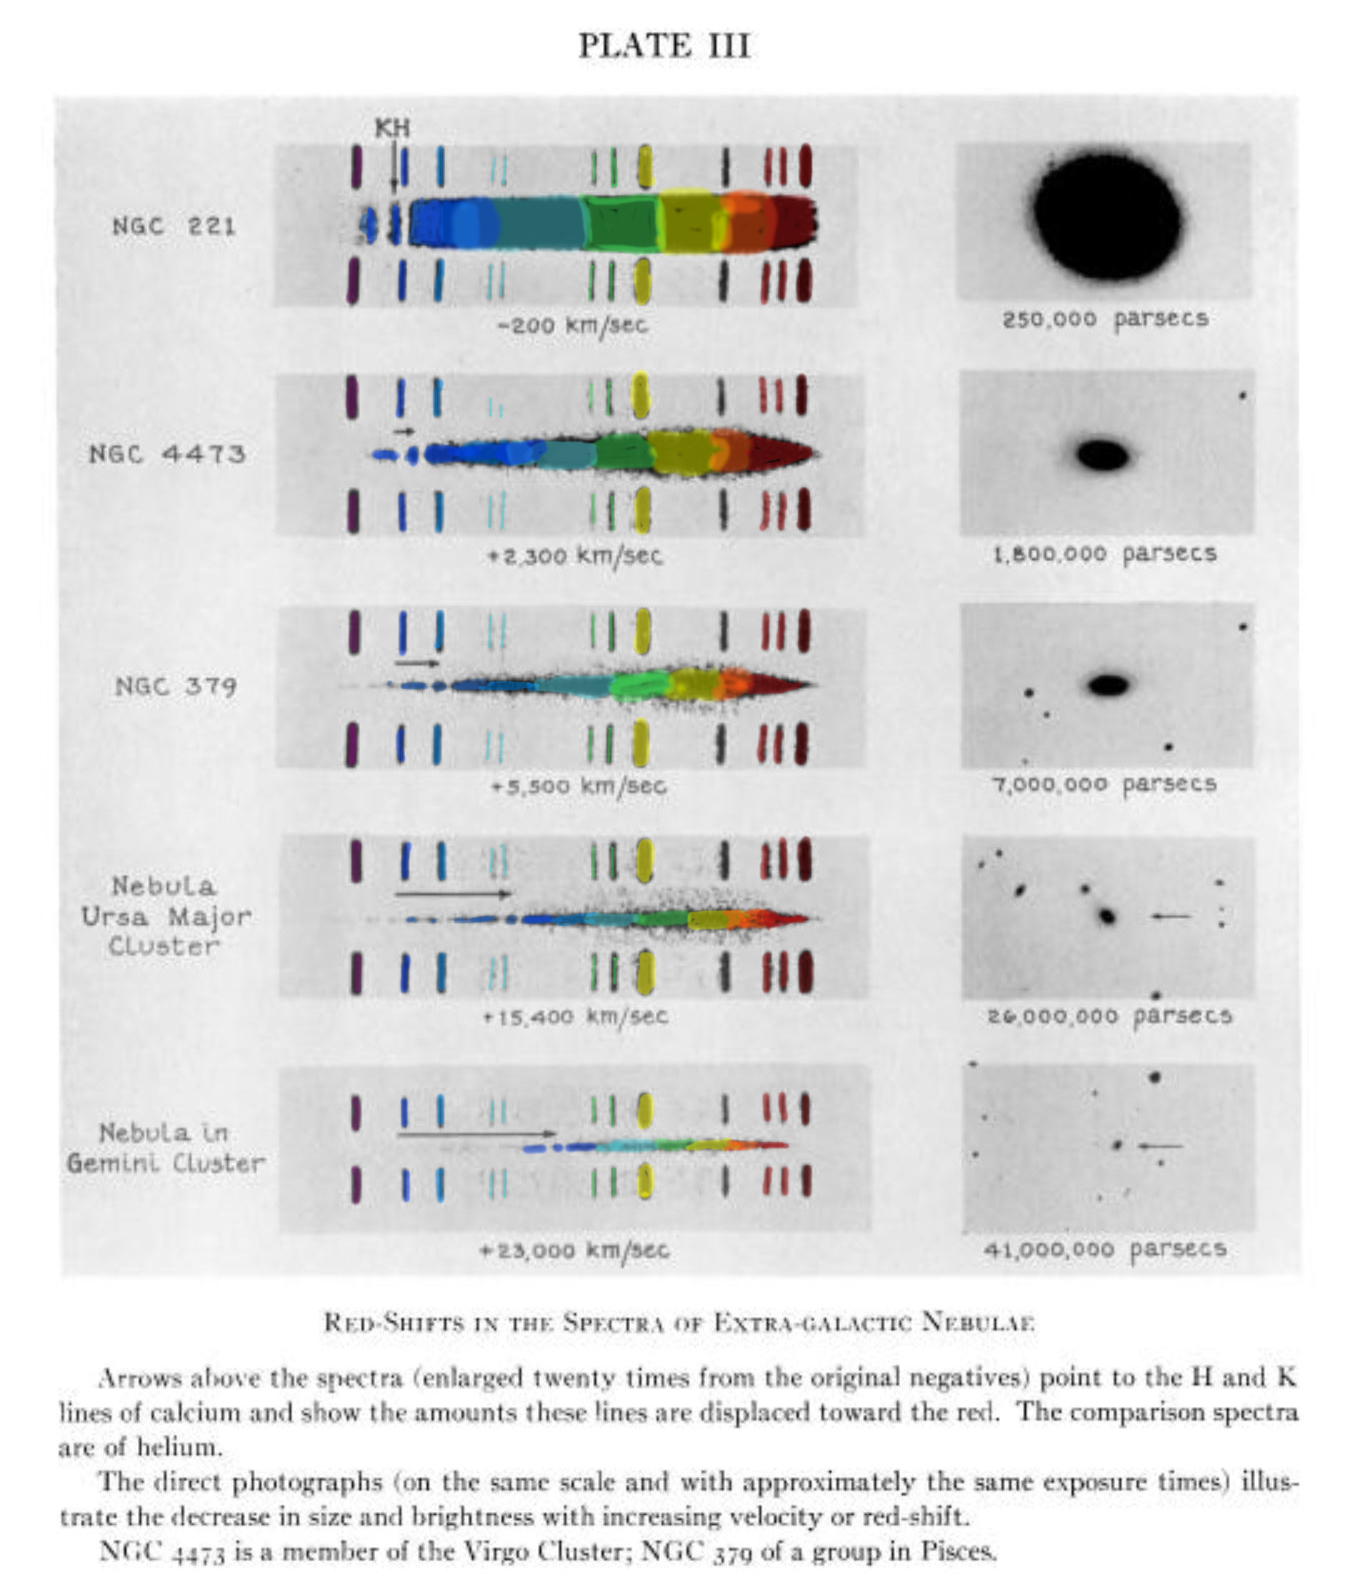
The Doppler effect was used to estimate the relative radial (or line of sight) velocity of celestial objects by comparing the position of spectral lines from the celestial object to those of a terrestrial light source by William Huggins in 1868. Later in 1913, Vesto Slipher measured the movement of H and K calcium absorption lines from magnified images of distant "nebulae" (galaxies) which he equated with a Doppler shift from a moving light source. In 1936, Mount Wilson astronomer Milton Humason published images for the first time actually showing the public the shifting of the very recognizable pair of calcium absorption lines. In the same year, Humason also published a paper relating that this shift supports the 1927 theory of astronomer and priest Georges Lemaître, which predicts an expanding universe based on Albert Einstein's General Theory of Relativity and on this observed shift of the calcium absorption lines. Both Humason and fellow Mount Wilson astronomer Edwin Hubble developed and popularized this "Doppler shifted light" theory through the 1930s and after World War II in the 1950s. This theory, that the observed shifting of the H and K calcium absorption lines in the spectrum of the distant spiral galaxies is due to Doppler shift, an indication of the velocity of a light source (figure 3), is currently overwhelmingly accepted and supported by the vast majority of professional and amateur astronomers alike in addition to the public.
The apparent shift in the spectral lines of most other galaxies, interpreted as a Doppler shift, which implies that most other galaxies are moving away from us at very high speeds, is perhaps the strongest experimental evidence in favor of the claim that the universe is expanding from a
primordial explosion, the "big bang". However, Huggins, Slipher and all later astronomers who have accepted
a shift of spectral line position as the result of Doppler shift never included or
considered the effect of distance (as demonstrated by the Bragg equation) of light source distance on spectrum size and position.
A careful examination of this simple law
shows that for any particular frequency of light there is only one angle of incidence to the grating groove
for each particular frequency of light. So the only way a more distant light source can have the same exact angle
of incidence as a closer light source is for that particular frequency of light to reflect off
the area of the grating farther away from the center (figure 1), node 0, that is, towards the red direction of the
spectrum.
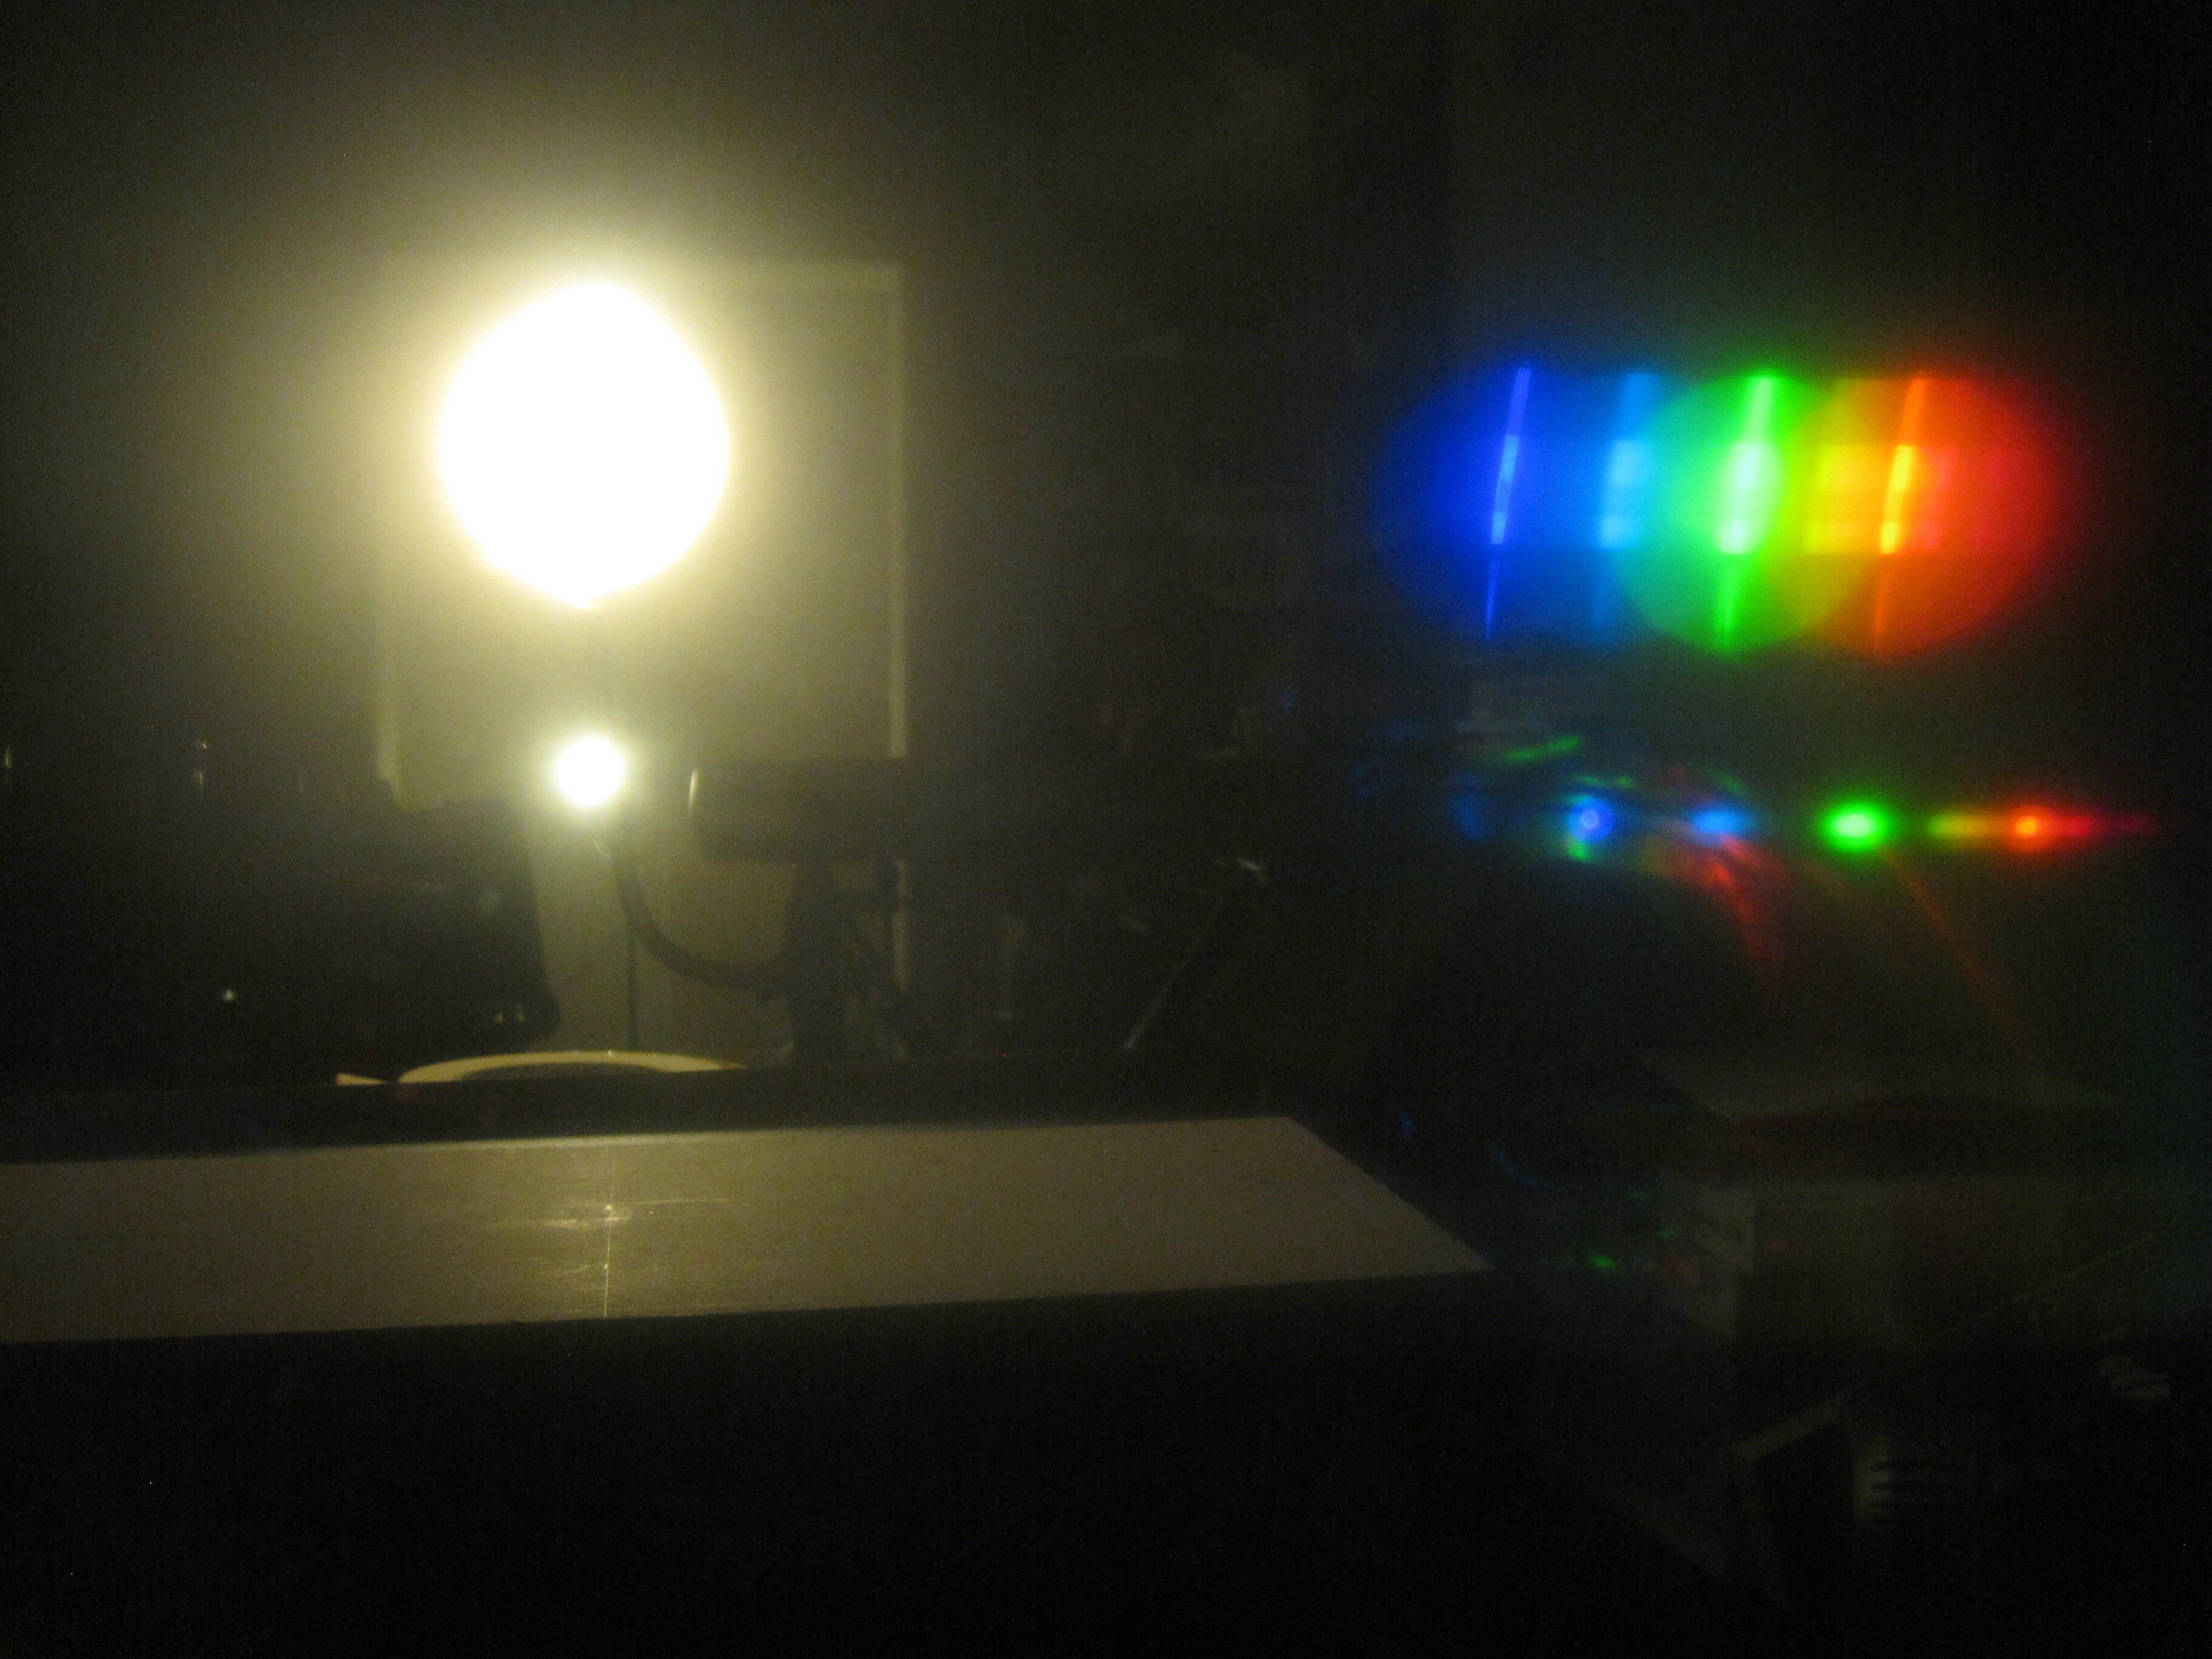
Simple photographs with two $10 lamps show this effect clearly (see figure 5). In fact this phenomenon can be used to get a rough estimate of the distance to a light source by seeing how far from center the spectrum is. Clearly, a large part, if not all of the observed shifting in Humason's 1936 image must be due to this "Bragg angle" shifting with light source distance, but also some shifting is due to the difference in the horizontal size of each light source when no slit is used. A color photo showing the equivalent spectra, might reveal that the H and K calcium lines are surrounded by the same blue color (and therefore unshifted high frequency light) even though they are apparently in a red region relative to unmagnified closely positioned hydrogen and helium spectral emission line reference light sources, may be another simple proof that this spectral line shift is mostly if not entirely a shift of position only, and not a shift in the frequency of light. In addition to this, the size of the light source changes the spectrum size and a smaller total size spectrum causes all outer spectral lines to move toward the center- so had there been absorption lines in the red part of the spectra of galaxies, those lines in a smaller, more distant galactic spectrum would shift to the center, in the blue direction, compared to their position in closer galactic spectra. If a slit is used to restrict the width of the light source, a more distant light may not be able to make the angle of incidence necessary to produce a spectrum and so the slit must be offset to the side in order to produce a spectrum, and this changes the position of the resulting spectrum compared to reference spectral lines too.
FULL ARTICLE
Francisco Grimaldi, was the first to theorize that light can not only reflect, and refract, but can also "diffract" in 16651. In 1674, Claude Dechales had noticed that colors are produced by light reflected from small scratches made in metal and glass, and this led to the first "diffraction" gratings (although Dechales showed this phenomenon to be strictly due to reflection from the scratch grooves).3 In 18232 Joseph von Fraunhofer was the first to equate the spacing between grooves of a
diffraction grating to the wavelength of the spectral line produced. Later in 19124
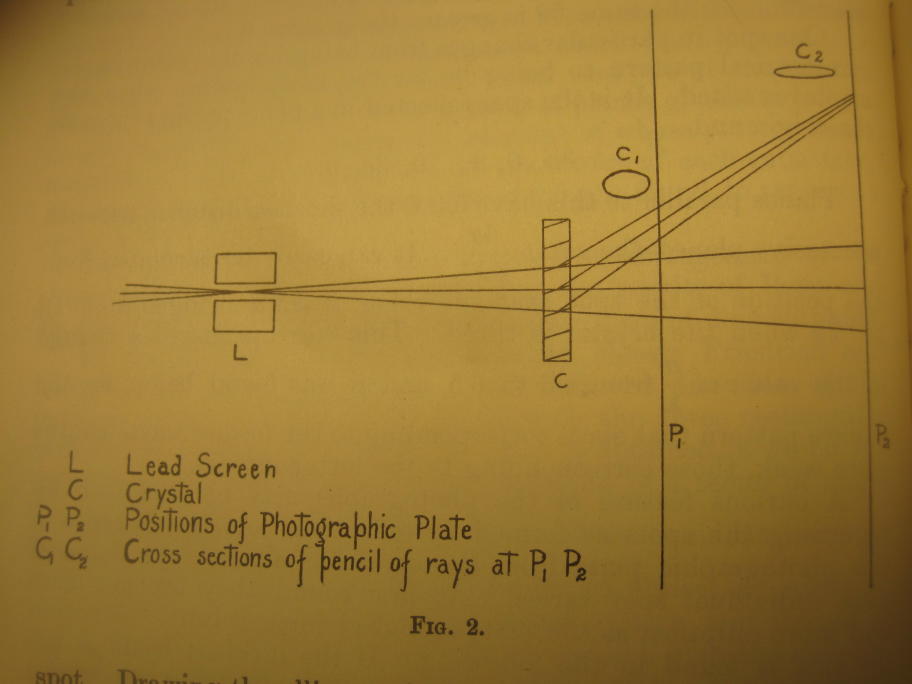
William Lawrence Bragg showed that Grimaldi's diffraction can be interpreted as particle reflection (figure 2), by applying a form of Fraunhofer's equation which he obtained from
Schuster's writings5, to explain the x-ray diffraction patterns caused by crystals
first observed by Max Laue6. The Bragg equation (perhaps more accurately called the
Fraunhofer equation) applies to all particle sources, no matter what what
frequency. This simple equation, nλ=2Dsin(θ) is true for all particle beams,
which includes all light, electron, proton, etc. beams. In the case for light, because
the Bragg equation connects the angle of incidence of the incoming light source with a
particular wavelength of light, simple geometry shows that the more distant a light source,
the farther away from the center of a diffraction grating the spectral line from a particular
wavelength of light will be. Figure 1 shows this simple relationship clearly.
Figure 1. The simple trigonometry that shows that two light sources at different distances cannot achieve the same angle at the same location on a horizontal diffraction grating. Note that this is for a transparent grating. This effect can be seen for two lamps at different distances in Figure 5.
Figure 2. Image from William Lawrence Bragg's 1912 paper "The Diffraction of Short Electromagnetic Waves by a Crystal" showing how diffraction can be interpreted as a particle reflection.
Figure 3. Image from Milton Humason's 1936 paper "The Apparent Radial Velocities of 100 Extra-Galactic Nebulae" (also reprinted in Edwin Hubble's book "The Realm of the Nebulae", 1936). Notice how the spectrum size gets smaller for each smaller light source, which in turn moves the lines closer to the center. Humason makes no mention of this or the Fraunhofer-Bragg equation for gratings.
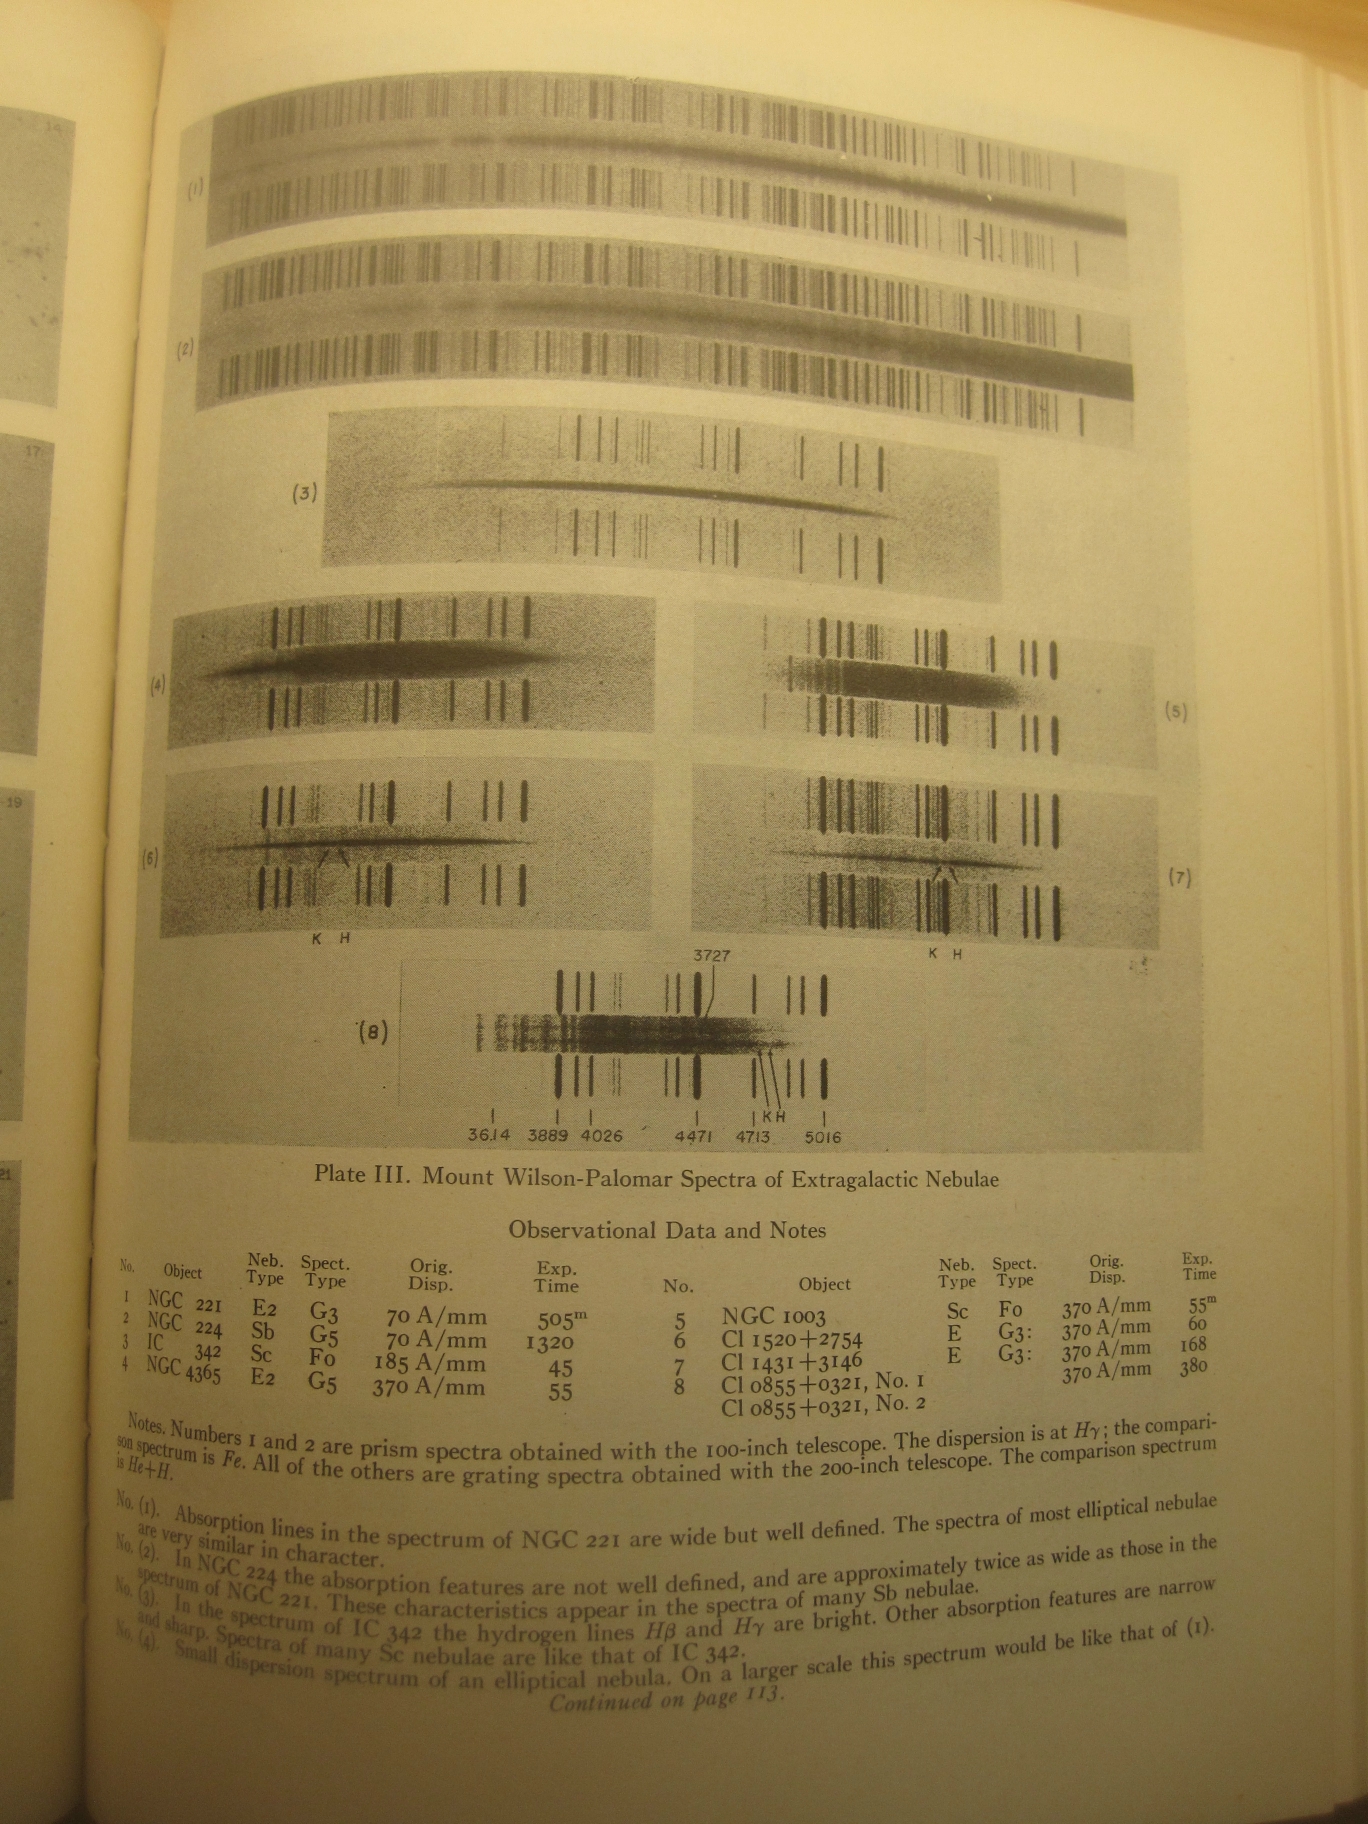
Figure 4. Image from Humason, Mayall and Sandage's 1956 paper "Redshifts and magnitudes of extragalactic nebulae.". Looking at the images of the supposed shifted H and K absorption lines in fig 6, 7, and 8, it's difficult to see any absorption lines where the arrows point. Perhaps at the higher resolution of the original photos some absorption lines were noticeable, but these photos certainly provide no evidence of absorption lines being where the arrows indicate (click on photo for closer view). If this was a pregnancy test, I think I would want second and clearer test.
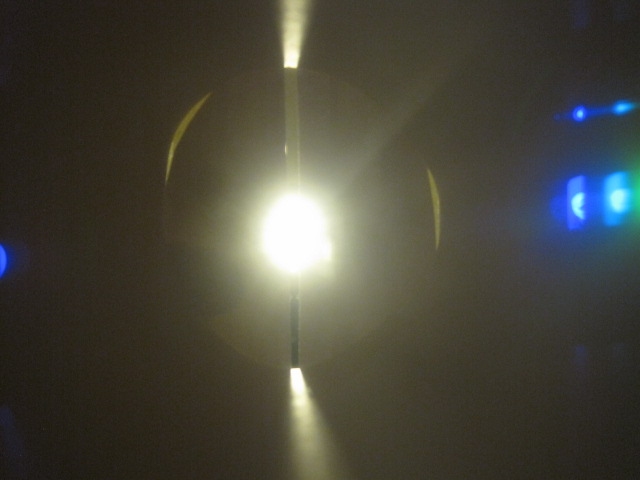
Figure 5. Image of a spectral line shift from a close and distant fluorescent lamp.
Video 1: Simulation of light particles with blue frequency (380 nm) reflecting off a grating at the angle of incidence needed to isolate blue light
Video 2: Simulation of light particles with yellow frequency (570 nm) reflecting off a grating at the angle of incidence needed to isolate blue light
Figure 6. Color image of three galactic spectra from the 1980 television series "Cosmos". Note how the third spectrum, which is a full spectrum, has no red. It seems hard to imagine that light from a galaxy would have no red color, in particular if shifted more into the red.
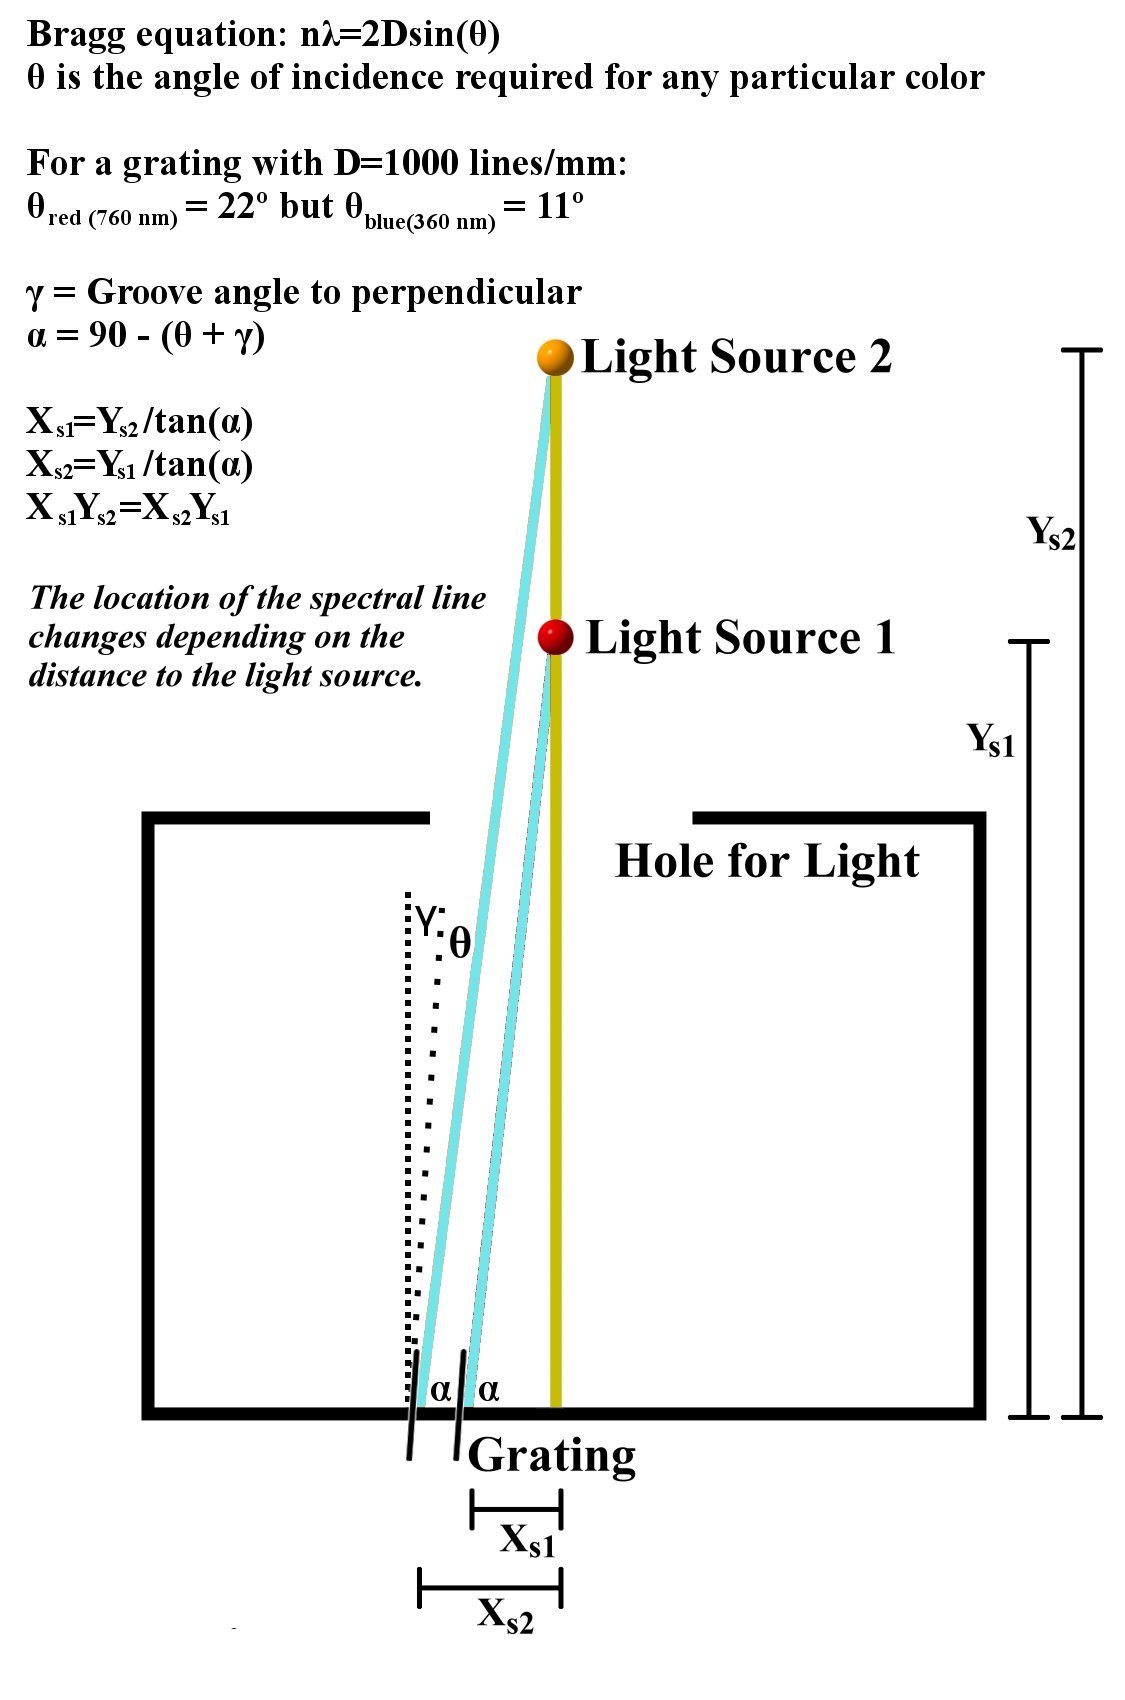
If there are two light
sources exactly aligned horizontally to a grating, and offset vertically for
clear viewing of the two spectra, and the distance to light source 1 is Ys1, the distance
to light source 2 is Ys2, for the angle of incidence, theta, that produces any particular
wavelength of light, the relationship between Xs1 and Xs2, the horizontal position of the
light beam causing the particular wavelength of light will be expressed by the equation:
Ys1Xs2=Ys2Xs1. This presumes the grating surface angle to be rectilinear, in practice the
grating angle is tilted.
The consequences of this shift, appear in my eyes, to be of
fundamental importance. In particular because for any determination of spectral line - the
distance to the light (or electron, etc) source significantly changes the position of the
spectral line. Because of this, to measure the position of emission or absorption spectral lines,
the exact distance to the sample must be kept constant and must be standardized. In addition, the width of the light source effects the size of the overall visible spectrum. In fact, the position of any particular spectral line from a light source can be used to give an estimate of the distance to the source. However, there is an asymptotic limit for light sources past a certain distance.
Perhaps of more significance is the role this effect may have on the position of the spectral lines of stars and galaxies magnified by telescopes. For any
measurement of the position of absorption or emission spectral lines from celestial objects, this
"Bragg equation shift" or displacement, must be included, aside from Doppler Shift, or
gravitational frequency shifting. So in addition to the simple comparison of size of galaxy based on perspective (actual width/apparent width = distance), the Bragg shift can be used to confirm the distance of a galaxy, and separate distance from a Doppler shift effect. So the significant change in position in spectral lines due to the Bragg equation effect, so easily observed with two simple lamps, brings the claim that the apparent shifting of the calcium absorption lines of the other galaxies is primarily
due to their relative velocity and the Doppler shift.
William Huggins was the first person to try to estimate the relative radial (or line of sight) velocity of celestial objects due to the Doppler effect, by comparing the position of spectral lines from the celestial object to those of a terrestrial light source.7 Vesto Melvin Slipher, working at the Percival Lowell's observatory in Flagstaff, Arizona, presumed that
the change in the position of spectral lines of different galaxies he observed is caused by Doppler
shift. Slipher was apparently unaware of the effect the distance and apparent size of light source have on spectral line position, and published his support of the theory that the observed changes in spectral lines is do to Doppler shift on October 20, 19138, less than a year after Bragg's November 11, 1912 paper which announced that diffraction of x-rays follows the simple equation for a grating and can be viewed more accurately as a particle reflection.
The theory of an expanding universe was first published by the astronomer and priest George Lemaître in 19279 who based this theory primarily on Albert Einstein's newly developed General Theory of Relativity and Slipher's explanation of Doppler shift explaining the shifting calcium absorption lines of the distant galaxies (although some people claim that the expanding universe theory was first described by Russian mathematician Alexander Friedmann in 192210.
Mount Wilson astronomers Milton Humason and Edwin Hubble adopted Slipher's Doppler shift explanation (figure 3). Also in 1936 Humason supports the theory of an expanding universe explaining the shifted absorption lines, crediting William de Sitter in 1916 as introducing the expanding universe11, but from a perspective based only on the public record, Slipher's Doppler shift theory was announced (in 1913) before the expanding universe theory was introduced by Lemaître in 1927.
It seems clear, that much of this
red shift is due to the simple geometrical fact of the Bragg equation: that the angle of
incidence depends on the distance of the light source. Figure 5 shows this effect well.
This is a simple photo of two fluorescent bulbs at different distances. Notice that the spectrum is shifted to the red, because the more distant
light can only make the required angle for any specific frequency of light at a position farther
from the center of the grating. The farther away the source, the farther from center is the
spectral line. In fact this phenomenon can be used to get a rough estimate of the distance to a light source by seeing how far from center the spectrum is.
If this movement of spectral lines is due mostly to the distance of the light source, and not to Doppler shift, this would invalidate the theory of an expanding universe, first put forward by Friedmann and Lemaître. What remains is perhaps a more dull, but nonetheless very interesting, and equally beautiful view: that we and the distant galaxies may not be moving away from each other at extremely fast speeds, but that, whatever those speeds are, they may be perhaps too small to be clearly detected based on perspective
and the expected Bragg equation shift measurements. It very well may be that the relative velocity between
galaxies is very small, that, in this sense, galaxies are like atoms in a gas or light
particles in an atom.
There are other important factors that are important in
trying to answer the question: "Where will the spectral line be located for two particle
beam sources with different distances?" A very major factor in this determination is the
quantity of magnification of a light source. For the spectrum of a light source to be seen,
it must be relatively close. For example without magnification distant galaxies cannot be
seen, and without magnification the spectrum of only the brightest stars and planets can be
seen. If a light source is magnified 1000 times, this is the equivalent of bringing the
light source 1000 times closer to the grating. For a magnified source, the equation for spectral line position is very simply:
Xs1*Magnification=Ys1/Tan(theta)
Another aspect is that the angle
of the grating groove is not perpendicular to the plane of the grating, but is angled in the shape of the blade or particle beam that
cuts the groove. That angle needs to be added to the angle of incidence for the Fraunhofer-Bragg equation: nλa=2Dsin(θ+groove angle).
==================
UNDER CONSTRUCTION
==================
To show how large this effect might be for a galaxy, here are some examples.
First of all, you can imagine that the two light sources in figure 5 are distant stars that have been magnified, because magnification only scales this effect.
Looking at the example of a grating with 1000nm spacing (D=1000 x 10-9), and the calcium "K" absorption line (wavelength, λ = 396.8 nm), with two light sources that are presumed to be the same size (10,000 light years in diameter), but at different distances, one appearing 1 cm wide, the other only 5 mm wide, in a telescope and eyepiece combination that magnifies light 500 times. Based simply on perspective (based on the surface area of a sphere: 4*pi*Radius^2 - note this is probably in error) is 4*pi*Distance^2=Diameter_Actual/Diameter_Apparent), the distance to the 1cm galaxy is 4*PI*Distance^2=Diameter_actual/(Diameter_apparent x Magnification) 10,000 ly/1
1cm= 1/9.46 × 10^17 cm ly = 1.057 x 10⁻¹⁸ ly
4*pi*Distance^2= 10,000ly/(1.057x10^-18 x 500) = 1.892 x 10^19 ly
Distance=1.22 billion light years away
While the 5mm galaxy would have a distance of
4*pi*Distance^2= 10,000ly/(5.285x10^-19 x 500) = 3.784 x 10^19 ly
Distance=1.74 billion light years away
The ratio of their distances is 1.4 (1.74x10^9/1.22x10^9).
On a grating of 1000 lines/mm (D=1um), the angle required for the calcium absorption line resonance (396.8 nm) is (see diagram, β is the angle the light makes with the grating groove surface- not with the grating top surface- ):
cos(β)=λ/D Beta=66 degrees.
If light source is viewed as 1 unit, the distance from center for the K calcium absorption line will be:
tan(β)=1/X X=0.43
But for light source 2, the more distance source, that appears as being only 5mm in diameter, at 1.4 the distance, the position on the grating will be:
tan(β)=1.4/X X=0.61
So the difference of the position of the calcium K line at the surface of the grating is in direct relation to the ratio of the distances of the light sources (0.61/0.43 = 1.4).
Videos 1 and 2 simulate a unidirection monochromatic set of particles. Video 1 shows an example of how a specific angle (or direction) of reflection off the regular interval of a grating may coincide with a specific particle interval (wavelength). Video 2 shows how the angle of reflection might not coincide with the regular interval of the particle beams. Although these videos do now show this, it can be seen how changing the angle of the groove would change the angle of reflection by the same amount.
================
END CONSTRUCTION
================
The actual details of the particle reflection explanation for "diffraction" that are described by the Fraunhofer-Bragg equation are more complicated than you might expect for so simple an equation: Many different frequencies of light reflect off each grating groove surface, in very small quantity for each groove. But for many angles of incidence, there is a resonance between multiple beams over a group of grooves which reflect specific frequencies of light particles in a single specific direction. All frequencies of light are reflected off the inside of the slanted groove, and are reflected in the same direction, but there is a stronger intensity (more light particles) for the particular interval (wavelength) that is related to the spacing between grooves in one particular direction. Many rays that land in between each groove are absorbed which amplifies that frequency related to the space between groves. For small frequencies of light, not many light rays reflect this way, because the space where the angle of incidence and groove spacing align for any frequency is very small, so the colorful spectrum of light is produced by a very small fraction of rays from the source light. One interesting added point is that the University of London professor, and critic of the theory of Relativity, Herbert Dingle, recognized this phenomenon of changing spectral line position with distance of light source based on the simple Bragg or "grating" equation in a 1960 paper12.
This is just an example thought-image and thought-sound experiment -many factors
do not even matter because this is a very simple geometrical principle - if a diffraction
phenomenon which is based on the reflection from regularly spaced planes that are spaced
at the wavelength reflected and that this spacing between planes depends on the angle of
light beam, then simple geometry requires that the angle of light beam for a particular
frequency must be the same for all sources, and that it is physically impossible for two
sources of different distance to have the same angle of incidence at the same location
on a grating. If this is true, then the particular wavelength, angle or distance of light
source is of much less importance.
Knowing this simple truth, there must be a wide
variety of gratings - very large gratings made of glass planes for example for radio, to
separate specific frequencies, and any of the many frequencies of particle beams like
those of light, electrons, protons, atoms, molecules, etc. The same concept can work in
theory for sound, presuming a partially reflecting partially transparent regularly spaced
set of planes.
Above is an image (figure 3) published in 1936 by Milton Humason13 and reprinted in the same year by Edwin Hubble14. Slipher's original paper in which he
is the first to presume that this changing of the position of spectral lines is due to Doppler
shift contains no spectral images. So in this image, the claim is very simple and clear - that
the H and K absorption lines, attributed to Calcium, appear to be located more towards the red,
longer wavelengths of light compared to a very close light source (helium) of fixed distance and
no relative velocity. However,
looking at figure 5, which is a photo of two $10 identical lamps from Target separated by about 500cm,
shows clearly, that the position of spectral lines changes with distance, (although the frequency
of the light and spectral lines, does not change in any way), just as the Fraunhofer-Bragg
equation requires. This effect looks strikingly similar to the photo of figure 3: the
image of the spectra of the magnified light sources
produced by Humason and provided by Hubble. We must be very grateful to have this photo from Humason and Hubble,
which provides people of now with a clear visual view of what those astronomers saw in their mind, and
what exactly they were claiming. So the conclusion is simple, this "shifting" of lines to the red is
mostly the result of the distance of the light source from the grating, the larger the displacement
of the spectral line, the larger the distance. This shifting has apparently very little to do with
Doppler shift. If you look at Figure 3, you can also see that even the blue portion of the more distant
galaxies appears to be partially blue shifted, perhaps because the apparent size of the light
source is smaller which makes the line width smaller. In addition, Slipher's, and later astronomer's
interpretation that the Andromeda galaxy, M31, is blue shifted, which implies that the galaxy is
moving towards us, must certainly be flawed too. Probably because M31 is the closest galaxy to the
Milky Way Galaxy, the spectral lines of M31 appear to be shifted less than the other more distant
galaxies. How Slipher could get the H and K absorption lines to appear more blue shifted than
a close fixed light source (although finding a simple photo of this has proven difficult)
could perhaps be because the close light source was not magnified.
If a slit is used to restrict the width of the light source, a more distant light may not be able to make the angle of incidence necessary to produce a spectrum and so the slit must be offset to the side in order to produce a spectrum, and this changes the position of the resulting spectrum compared to reference spectral lines too. Figures 7-9 show the effect of using a slit. Humason comments in his 1936 paper that he uses variable slit-widths "...in order that the comparison might always be with a spectrum similar in appearance and scale.". If the light source is smaller than the slit, the size of the spectrum is also smaller, and as a result of this smaller scale, any spectral lines are moved closer to the center as is most obvious in Humason's spectra of 1936 (figure 3). If these spectra are being scaled, as Humason planely states, obviously this makes the position of spectral lines vary.
Figure 7. Two identical lamps at different distances without a slit.
Figure 8. The same lamps with a slit. Notice that the more distant light cannot make the angle needed to produce a spectrum.
Figure 9. The same lamps with the slit offset to the right to allow the farther light source to produce a spectrum.
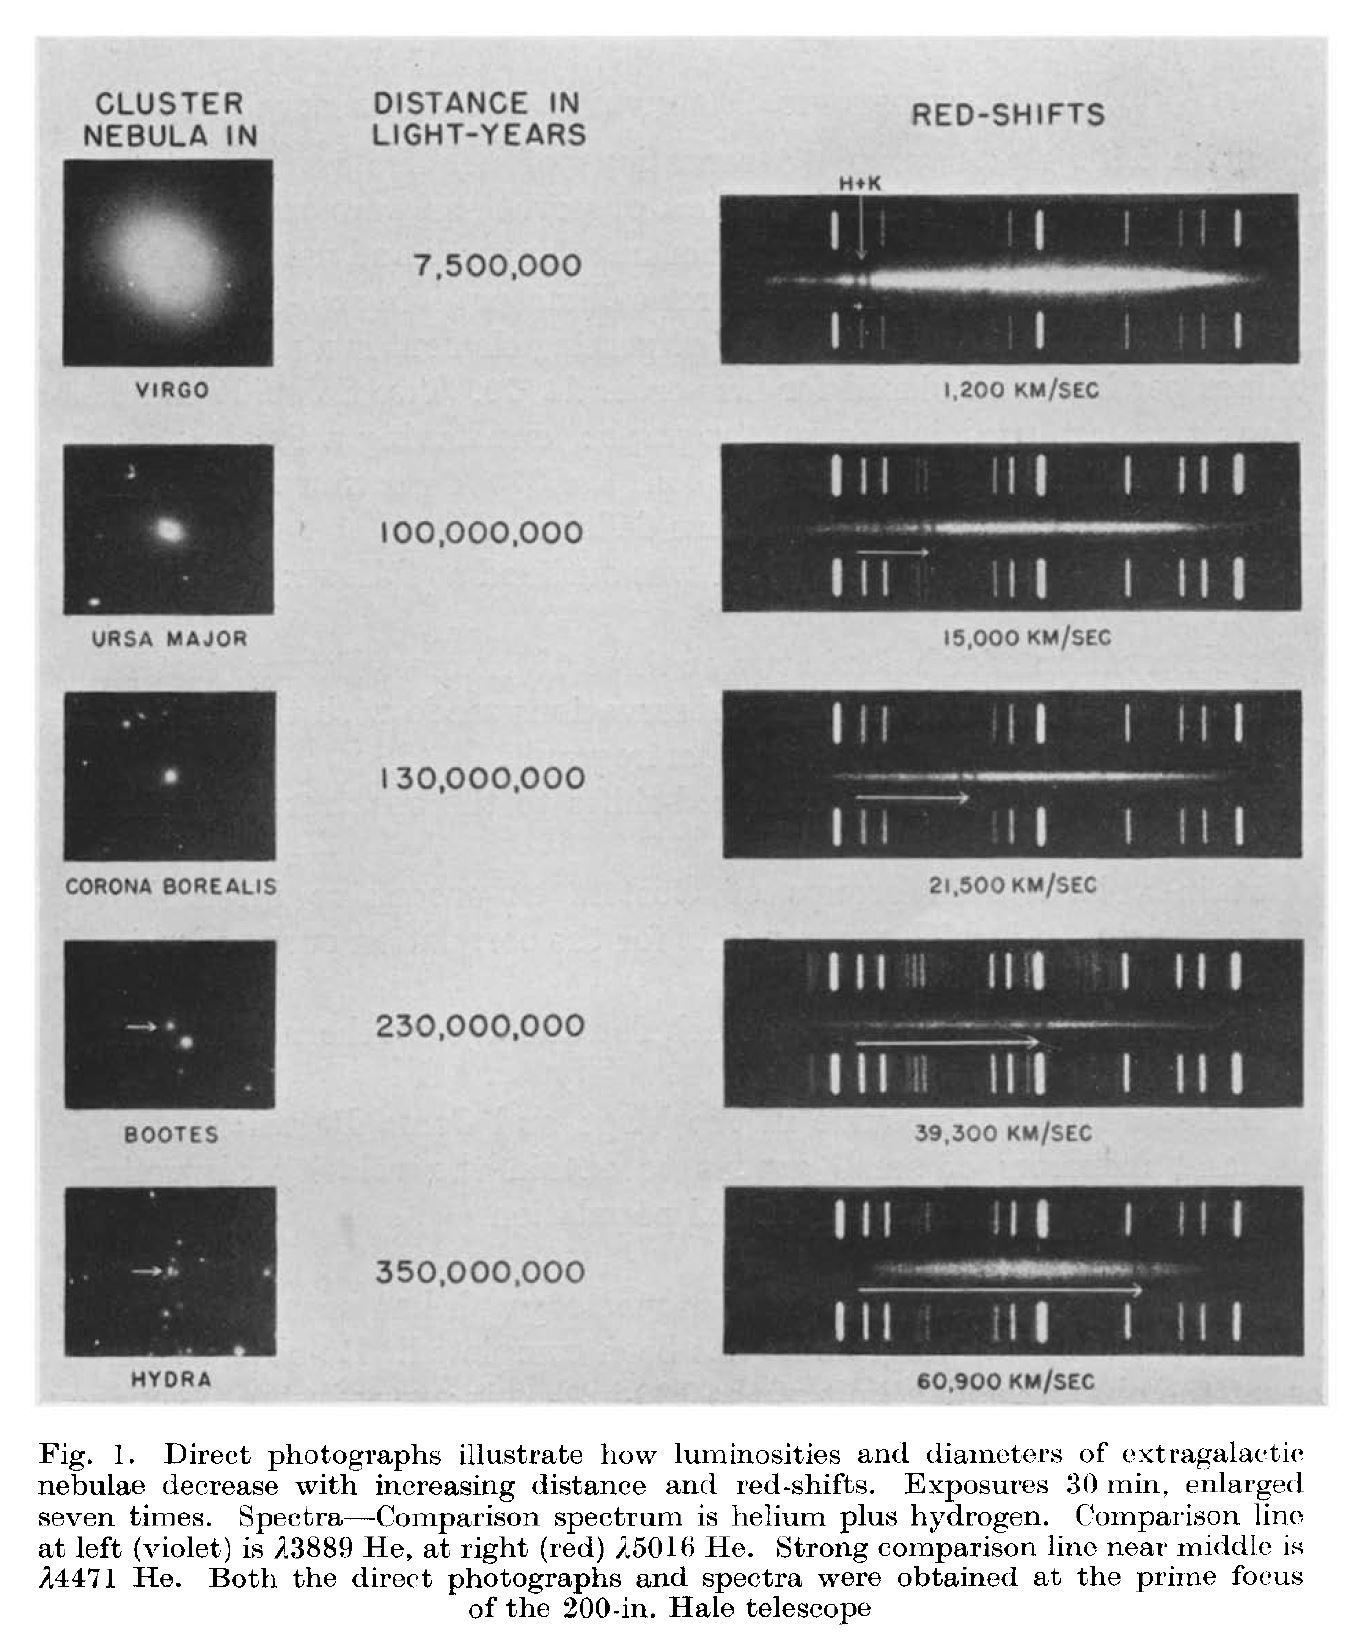
The development of this story is somewhat long in duration because twenty years later, in 195615, Humason publishes a second photo (see figure 4), this time with co-authors Mayall and Sandage, which claim to show even larger H and K absorption line shifting for very distant galaxies. Looking at the images of the supposed shifted H and K absorption lines in spectra 6, 7, and 8, it's difficult to see any absorption lines where the arrows point. Perhaps at the higher resolution of the original photos some absorption lines were noticeable, but these photos certainly provide no evidence of absorption lines being where the arrows indicate. In addition, there are many absorption lines in the various spectra shown; if there are absorption lines where the arrows indicate, perhaps they are absorption lines other than the H and K lines.
Finding color images like those produced by Humasen in 1936 (figures 3 and 4) in color has proven to be a challenge. One color galactic spectrum I found was in the wonderful 1980 Carl Sagan PBS television series "Cosmos" (see figure 6). Note how the third spectrum, which is a full spectrum, has no red. It seems hard to imagine that light from a galaxy would have no red color, in particular if shifted more into the red. It might be thought that the entire spectrum might be shifted to the red, but yet the spectrum does not appear to be in the calibrated red portion of the grating where the grating spacing and light angle of incidence match the red wavelength of light. If we presume that only the calcium lines move, then still there should be a red colored portion of the spectrum at the right-most end of the galactic spectrum. Perhaps these spectra were "colorized". If so, then these images should be clearly identified as not actual, and the true colors of a galactic spectrum and the relative position of the calcium absorption lines, something so basic and simple, may apparently remain yet to be seen publicly.
One single color photo of the spectrum of any distant spiral galaxy may be enough to show that the color, that is the actual frequency of light, surrounding the H and K calcium absorption lines is blue. If this color is blue, it can only mean that the position of the spectral line has moved, but the frequency of light in the spectrum is still, for the most part, the same frequency- the frequency of blue light.
1 P. Francesco Maria Grimaldo, "Physico-mathesis de lumine, coloribus, et iride", 1665. http://books.google.com/books?id=sZE_AAAAcAAJ 3 The History and Present State of Discoveries Relating to Vision, Light and Colours, Joseph Priestley, 1772, kraus reprint 1978, p180. 2 Fraunhofer, Jos., "Kurzer Bericht von den Resultaten neurer Versuche über die Gesetze des Lichtes, und die Theorie derselben", Annalen der Physik, v74, i8, 1823, pp. 337-378.
http://dx.doi.org/10.1002/andp.18230740802
Excerpts can be found in an English translation:
"SHORT ACCOUNT OF THE RESULTS OF NEW EXPERIMENTS ON THE LAWS OF LIGHT AND THEIR THEORY" : J. S. Ames (ed.), Prismatic and Diffraction Spectra: Memoirs by Joseph von Fraunhofer, New York 1898, pp. 39-61. http://books.google.com/books?hl=en&id=5GE3AAAAMAAJ 4Bragg, W.L. The Diffraction of Short Electromagnetic Waves by a Crystal. Proceedings of the Cambridge Philosophical Society, 1913: 17, pp. 43-57. http://tedhuntington.com/ulsf/docs_pd/Bragg_William_Lawrence_19121111.pdf 5Sir Arthur Schuster, "An Introduction To The Theory Of Optics", E. Arnold, 1904, p107-111. http://books.google.com/books?id=w2BDAAAAIAAJ 6 W. Friedrich, P. Knipping, M. Laue, "Interferenzerscheinungen bei Röntgenstrahlen", Annalen der Physik, Volume 346, Issue 10, pages 971–988, 1913. http://onlinelibrary.wiley.com/doi/10.1002/andp.19133461004/abstract
Free version: http://tedhuntington.com/ulsf/docs_pd/Laue_Max_19130315.pdf
English translation:
"Interference effects in Röntgen rays" 7Huggins, William. "Further Observations on the Spectra of Some of the Stars and Nebulae, with an Attempt to Determine Therefrom Whether These Bodies are Moving towards or from the Earth, Also Observations on the Spectra of the Sun and of Comet II., 1868." Philosophical Transactions of the Royal Society of London 158 (1868): 529-564. http://www.jstor.org/stable/10.2307/108925. 8Slipher, V. M., "The radial velocity of the Andromeda Nebula", Lowell Observatory Bulletin, vol. 1, pp.56-57. http://adsabs.harvard.edu/full/1913LowOB...2...56S. 9G Lemaitre, "Un Univers homogčne de masse constante et de rayon croissant" ("A homogeneous universe of constant mass and increasing radius"), Ann. Soc. Sci. Brux., 47A, 1927.
English translation:
G Lemaître, "A homogeneous universe of constant mass and increasing radius accounting for the radial velocity of extra-galactic nebulae", Monthly Notices of the Royal Astronomical Society, 1931 http://adsabs.harvard.edu/full/1931MNRAS..91..483L 10A. Friedman, A. "Über die Krümmung des Raumes". Zeitschrift für Physik 10 (1): 1922, p377–386. http://adsabs.harvard.edu/abs/1922ZPhy...10..377F
English translation in: A. Friedman, "On the curvature of space", General Relativity and Gravitation 31 (12), 1999, p1991–2000. http://www.springerlink.com/content/pg1414x04401n734/ 11Humason, M. L., "The Apparent Radial Velocities of 100 Extra-Galactic Nebulae", Astrophysical Journal, vol. 83, p.10, Jan 1936. http://articles.adsabs.harvard.edu//full/1936ApJ....83...10H/0000010.000.html 12H. Dingle, "Relativity and Electromagnetism: An Epistemological Appraisal", Philosophy of Science, 27, p233-253 (1960). http://www.jstor.org/stable/185967 13Hubble, E. P., "The realm of the nebulae", Yale University Press, 1936, p117. 14ML Humason, NU Mayall, AR Sandage, "Redshifts and magnitudes of extragalactic nebulae.", The Astronomical Journal, 61, p97-162 (1956) http://adsabs.harvard.edu/full/1956AJ.....61...97H 15M. L. Humason, "Evidence for an Expanding Universe", The Scientific Monthly , Vol. 43, No. 1 (Jul., 1936), pp. 80-83 http://www.jstor.org/stable/16224
For reference, and with a hope that more modern digital images of the complete spectrum can be made public, the modern names for the galaxies Humason photographed in 1936 are:
Humason name: Cl 1144+5601, RA 11h 44m 5s DEC +56° 1 type=E (elliptical) Spectral Type=G5 mag=15.9, Anon7 UMa Cl. No. 1
Modern name: PGC 36774
Image: http://server4.sky-map.org/starview?object_type=2&object_id=24121
03/04/2014 comment: One amazing result of this phenomenon is that an image that is passed through a grating and then filtered to show only a single frequency of light can be compared to the original image, and (although it is probably a complex procedure) the distance of major objects can be determined by the amount of shifting of the image of the object. Note that this is easy to do for various light sources, but can also be done for any object using a very low (radio) light particle frequency since all matter emits light particles in low frequencies. This could be another (faster, non-contacting, remote, and less easily detectable) option besides radar (reflection) to determine the distance of any object.
1/11/2024 comment: take a look at what I think a color Plate 3 would look likeand notice how the calcium absorption lines appear to be in the same blue portion of all 5 spectra:
In addition, I want to add a 1956 black and white set of spectra that Humason made with the larger 200" telescope where the thought-to-be calcium absorption lines are unquestionably far away from the blue end of the galactic spectra for the most distant galaxies:
Note that there are apparently many galaxies that do not show calcium absorption lines, and I think it cannot be ruled out that these absorption lines may be due to some other elements. It would be interesting to find spectra from galaxies that appear to have prominent double absorption lines in other parts of their spectrum. This image is from Milton L. Humason,Red-shifts in the spectra of extragalactic nebulae,Vistas in Astronomy,Volume 2,1956,Pages 1620-1628,ISSN 0083-6656,https://doi.org/10.1016/0083-6656(56)90089-7.
Then compare spectra fig 7 and fig 8 in the below image from a 1956 photo from Humason, Mayall, and Sandage (see below citation), the other 1956 photo from Humason alone (see above citation) with Bootes (spectra 4) and Hydra (spectrum 5)- clearly the spectra look different, spectrum 8 has more defined spectral lines in other parts of the spectrum, than the same spectrum (5) in the Humason alone 1956 publication, but then in that spectrum (5) while all the other spectral lines are not apparent, the calcium absorption lines are even more apparent than in the other (fig 8) spectrum. If this was just a different in contrast would not the other spectral lines appear even more clearly too?
Humason, Mayall, and Sandage,Redshifts and magnitudes of extragalactic nebulae,Astronomical Journal, Vol. 61, p. 97-162 (1956),
10.1086/107297.